Google Analytics Team Introduce to track your websites by week and by month on graphical mode They have made it even easier for you to use Google Analytics to create clear and effective management dashboards without having to extract data into other programs. It clearly visualizing trends in weekly or monthly units, in addition to day by day. Have fun with this feature! Watch the patterns come into focus.
Look the graphing views for weekly and monthly can be used by viewing the data by day, which used to be the only option as a image follows
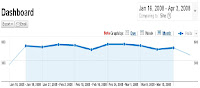
Graph by Day:

Graph by Week:
Graph by Month:

Check out the latest news about Analytics from
Google analytics blog


No comments:
Post a Comment